转载请注明出处:Just Do IT :: http://www.toplee.com/blog/?p=178
TrackBack URL: http://www.toplee.com/blog/wp-trackback.php?p=178
我已经喜欢上了Image_Graph, 它简单好用而功能强大,这里在上次入门介绍基础上进一步讨论一下这个包。
Image_Graph入门请参考这篇Blog:http://www.toplee.com/blog/?p=169
使用背景图片
有些时候,我们需要实现效果更加丰富的图表,比如为客户增加必要的背景图片,这里我们在上次讨论的image_graph4.php 基础上增加图表的背景图片.
2image_graph1.php
addNew(‘plotarea’);
$Dataset =& Image_Graph::factory(‘dataset’);
$Dataset->addPoint(‘Jan’, 5, ‘J’);
$Dataset->addPoint(‘Feb’, 13, ‘F’);
$Dataset->addPoint(‘March’, 10, ‘M’);
$Plot =& $Plotarea->addNew(‘bar’, &$Dataset);
$Plot->setLineColor(‘green’);
$Plot->setBackgroundColor(‘green@0.1’);
$fill =& Image_Graph::factory(‘Image_Graph_Fill_Array’);
$fill->addColor(‘red’, ‘J’);
$fill->addColor(‘blue’, ‘F’);
$fill->addColor(‘yellow’, ‘M’);
$Plot->setFillStyle($fill);
//set Background
$bgfill =& Image_Graph::factory(‘Image_Graph_Fill_Image’, ‘images/helicopter.jpg’);
$Plotarea->setFillStyle($bgfill);
$Font =& $Graph->addNew(‘ttf_font’, ‘Bitstream-Vera-Sans-Mono’);
$Font->setSize(12);
$Graph->setFont($Font);
$YAxis =& $Plotarea->getAxis(IMAGE_GRAPH_AXIS_Y);
$YAxis->setTitle(‘Rainy Days’, ‘vertical’);
$XAxis =& $Plotarea->getAxis(IMAGE_GRAPH_AXIS_X);
$XAxis->setTitle(‘Month’);
$Graph->done();
?>
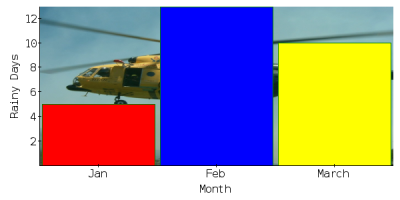
不幸的是,此时我们看到的背景图片被前面的图表遮盖,我们需要让它看起来更好看一些,这里可以通过使图表透明的方法来实现。修改下面的几行代码:
$fill->addColor(‘red@0.8’, ‘J’);
$fill->addColor(‘blue@0.5’, ‘F’);
$fill->addColor(‘yellow@0.2’, ‘M’);
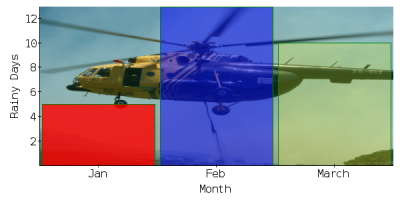
现在我们能看到全部的直升飞机图片,大多数的图片可以在0.2的参数下达到最好的透明效果。
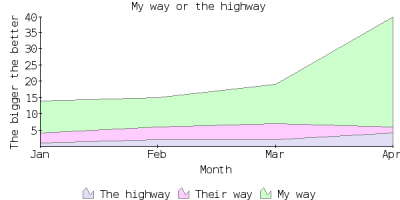
图表堆叠
下面我们将两组数据产生的图表进行堆叠,这里采用上下堆叠的方式。
2image_graph2.php
addNew(‘ttf_font’, ‘Bitstream-Vera-Sans-Mono’);
$Font->setSize(12);
$Graph->setFont($Font);
$Graph->add(
Image_Graph::vertical(
Image_Graph::factory(‘title’, array(‘My way or the highway’, 12)),
Image_Graph::vertical(
$Plotarea = Image_Graph::factory(‘plotarea’),
$Legend = Image_Graph::factory(‘legend’),
90
),
5
)
);
$Legend->setPlotarea($Plotarea);
// Create and populate 3 datasets
$Dataset1 =& Image_Graph::factory(‘dataset’);
$Dataset1->addPoint(‘Jan’, 1);
$Dataset1->addPoint(‘Feb’, 2);
$Dataset1->addPoint(‘Mar’, 2);
$Dataset1->addPoint(‘Apr’, 4);
$Dataset2 =& Image_Graph::factory(‘dataset’);
$Dataset2->addPoint(‘Jan’, 3);
$Dataset2->addPoint(‘Feb’, 4);
$Dataset2->addPoint(‘Mar’, 5);
$Dataset2->addPoint(‘Apr’, 2);
$Dataset3 =& Image_Graph::factory(‘dataset’);
$Dataset3->addPoint(‘Jan’, 10);
$Dataset3->addPoint(‘Feb’, 9);
$Dataset3->addPoint(‘Mar’, 12);
$Dataset3->addPoint(‘Apr’, 34);
$Dataset1->setName(‘The highway’);
$Dataset2->setName(‘Their way’);
$Dataset3->setName(‘My way’);
$Datasets = array($Dataset1,$Dataset2,$Dataset3);
$Plot =& $Plotarea->addNew(‘Image_Graph_Plot_Area’, array($Datasets,’stacked’));
$Plot->setLineColor(‘gray’);
$FillArray =& Image_Graph::factory(‘Image_Graph_Fill_Array’);
$FillArray->addColor(‘slateblue@0.2’);
$FillArray->addColor(‘fuchsia@0.2’);
$FillArray->addColor(‘lime@0.2’);
// set a standard fill style
$Plot->setFillStyle($FillArray);
$XAxis =& $Plotarea->getAxis(IMAGE_GRAPH_AXIS_X);
$XAxis->setTitle(‘Month’);
$YAxis =& $Plotarea->getAxis(IMAGE_GRAPH_AXIS_Y);
$YAxis->setTitle(‘The bigger the better’, ‘vertical’);
// output the Graph
$Graph->done();
?>
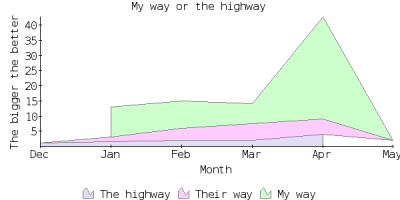
在这里我们使用了相同的month作为横轴标记,如果我们改变任何一个点的标记,图表会跟着改变,比如我们在第一个数据集中用Dec替换Jan,修改如下:
$Dataset1->addPoint(‘Dec’, 1);
$Dataset1->addPoint(‘Feb’, 2);
$Dataset1->addPoint(‘Mar’, 2);
$Dataset1->addPoint(‘Apr’, 4);
在数据集2中添加一个新的标记
$Dataset1 =& Image_Graph::factory(‘dataset’);
$Dataset1->addPoint(‘Dec’, 1);
$Dataset1->addPoint(‘Feb’, 2);
$Dataset1->addPoint(‘Mar’, 2);
$Dataset1->addPoint(‘Apr’, 4);
$Dataset2 =& Image_Graph::factory(‘dataset’);
$Dataset2->addPoint(‘Jan’, 3);
$Dataset2->addPoint(‘Feb’, 4);
$Dataset2->addPoint(‘Apr’, 5);
$Dataset2->addPoint(‘May’, 2);
Leave a Reply